A peak methane level of 3026 ppb was recorded by the MetOp-B satellite at 469 mb on December 11, 2021 am.
This follows a peak methane level of 3644 ppb recorded by the MetOp-B satellite at 367 mb on November 21, 2021, pm.
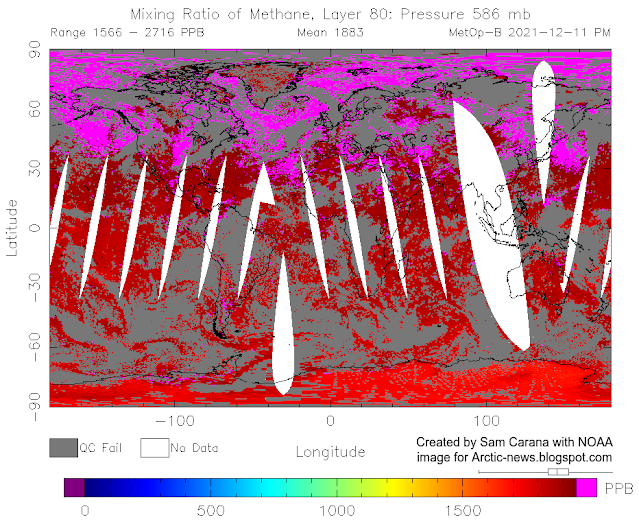
A peak methane level of 2716 ppb was recorded by the MetOp-B satellite at 586 mb on December 11, 2021, pm, as above image shows. This image is possibly even more terrifying than the image at the top, as above image shows that at 586 mb, i.e. much closer to sea level, almost all methane shows up over sea, rather than over land, supporting the possibility of large methane eruptions from the seafloor, especially in the Arctic.
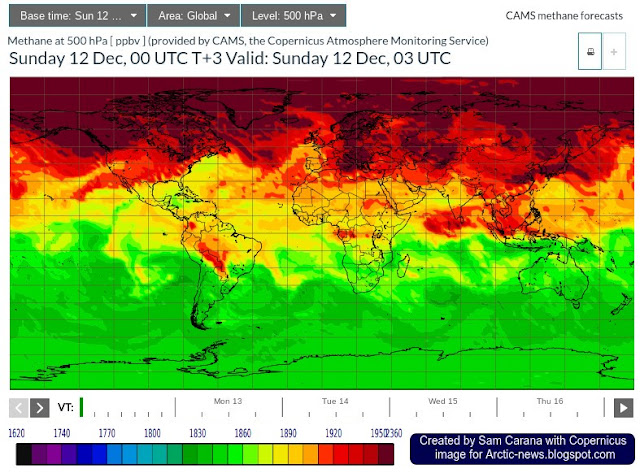
Also, the image was recorded later than the image at the top with the 3026 ppb peak, indicating that even more methane may be on the way. This appears to be confirmed by the Copernicus forecast for December 12, 2021, 03 UTC, as illustrated by the image below, which shows methane at 500 hPa (equivalent to 500 mb).
What causes these terrifying methane levels?
As the combination image below shows, the sea surface temperature north of Svalbard was as high as 4.3°C (or 39.74°F, green circle in the left panel) on December 12, 2021, i.e. as much as 5°C (or 9°F, green circle in the right panel) higher than 1981-2011.
 |
| [ click on images to enlarge ] |
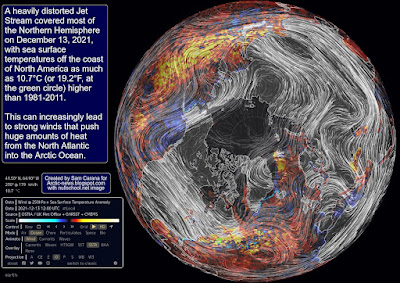
As temperatures in the Arctic keep rising faster than elsewhere in the world, the Jet Stream gets ever more distorted. The image on the right shows a heavily distorted Jet Stream covering most of the Northern Hemisphere on December 13, 2021, with sea surface temperatures off the coast of North America as much as 10.7°C (or 19.2°F, at the green circle) higher than 1981-2011.
At times, this can lead to very strong winds that push huge amounts of heat from the North Atlantic into the Arctic Ocean.
The image on the right is a forecast for December 14, 2021, showing strong wind causing waves as high as 8.3 m (or 27.2 ft) off the coast of Norway, speeding up the flow of warm water as it dives underneath the sea ice north of Svalbard.
Huge amounts of heat can thus move into the Arctic Ocean, driven by ocean currents and temperature differences.
 |
| [ The buffer is gone, from earlier post ] |
Sea ice used to act as a buffer, by consuming energy in the process of melting, thus avoiding that this energy could raise the temperature of the water of the Arctic Ocean. As above image indicates, the buffer has now virtually disappeared.
The image on the right, also from that earlier post, shows the October 2021 temperature anomaly, with anomalies over the Arctic showing up of as much as 9.1°C.
Heat that was previously melting the ice or that was getting transferred to the atmosphere is now instead heating up the water. Some 75% of ESAS (East Siberian Arctic Shelf) is shallower than 50 m. Being shallow, these waters can easily warm up all the way down to the sea floor, where heat can penetrate cracks and conduits, destabilizing methane hydrates and sediments that were until now sealing off methane held in chambers in the form of free gas in these sediments.
Sealed off from the atmosphere by sea ice, greater mixing of heat in the water will occur down to the seafloor of the Arctic Ocean.
 |
| [ From the post September 2015 Sea Surface Warmest On Record ] |
There are some further factors that can contribute to the high methane levels over the Arctic. As the sea ice grows in extent, this results in less moisture evaporating from the water, which together with the change of seasons results in lower hydroxyl levels at the higher latitudes of the Northern Hemisphere, in turn resulting in less methane getting broken down in the atmosphere over the Arctic.
Also, as land around the Arctic Ocean freezes over, less fresh water will flow from rivers into the Arctic Ocean. As a result, the salt content of the Arctic Ocean increases, all the way down to the seafloor of the Arctic Ocean, making it easier for ice in cracks and passages in sediments at the seafloor to melt, allowing methane contained in the sediment to escape. Meanwhile, salty and warm water (i.e. warmer than water that is present in the Arctic Ocean) keeps getting carried along the track of the Gulf Stream into the Arctic Ocean.
The threat
 |
| [ The Buffer has gone, feedback #14 on the Feedbacks page ] |
The threat is that some of the extra heat will reach sediments at the seafloor of the Arctic Ocean that contain huge amounts of methane in currently still frozen hydrates and in pockets of gas underneath.
 |
Cracks and holes in these sediments that are filled with ice can, as the ice melts away, become passageways for heat to destabilize hydrates, causing an eruption of gas as the methane expands to 160 times its frozen volume. The shockwave resulting from such an eruption can then destabilize neighboring hydrates.
NOAA’s most recent global mean methane reading is 1890.9 ppb for August 2021, with a trend of 1894.8 ppb. Meanwhile, NOAA’s global mean methane level will have risen further (December levels are typically more than 10 ppb higher than August levels), while NOAA’s data are also for marine surface measurements, and more methane tends to accumulate at higher altitudes.
As illustrated by the image below, methane on December 26 am, 2021, reached a global mean of 1939 ppb between 293 mb and 280 mb, while the highest peak level (2554 ppb) was reached higher in the atmosphere, at 218 mb.
 |
| [ click on images to enlarge ] |
The animation on the right, showing methane on December 31, 2021 am, may be helpful in analysis of the origin of these terrifying methane levels.
Conclusion
The situation is dire and calls for the most comprehensive and effective action, as described at the Climate Plan.
Links
• NOAA Infrared Atmospheric Sounding Interferometer (IASI) Sounding Products
• Carbon Cycle Gases, NOAA, Barrow Atmospheric Baseline Observatory, United States
• Warning of mass extinction of species, including humans, within one decade
• Human Extinction by 2022?
• The Methane Threat
• High methane levels over the Arctic Ocean on January 14, 2014
• The Importance of Methane
• Will COP26 in Glasgow deliver?
• When Will We Die?
https://arctic-news.blogspot.com/p/climateplan.html


